1966-2026: 60 Years of Illuminating with Excellence and Purpose
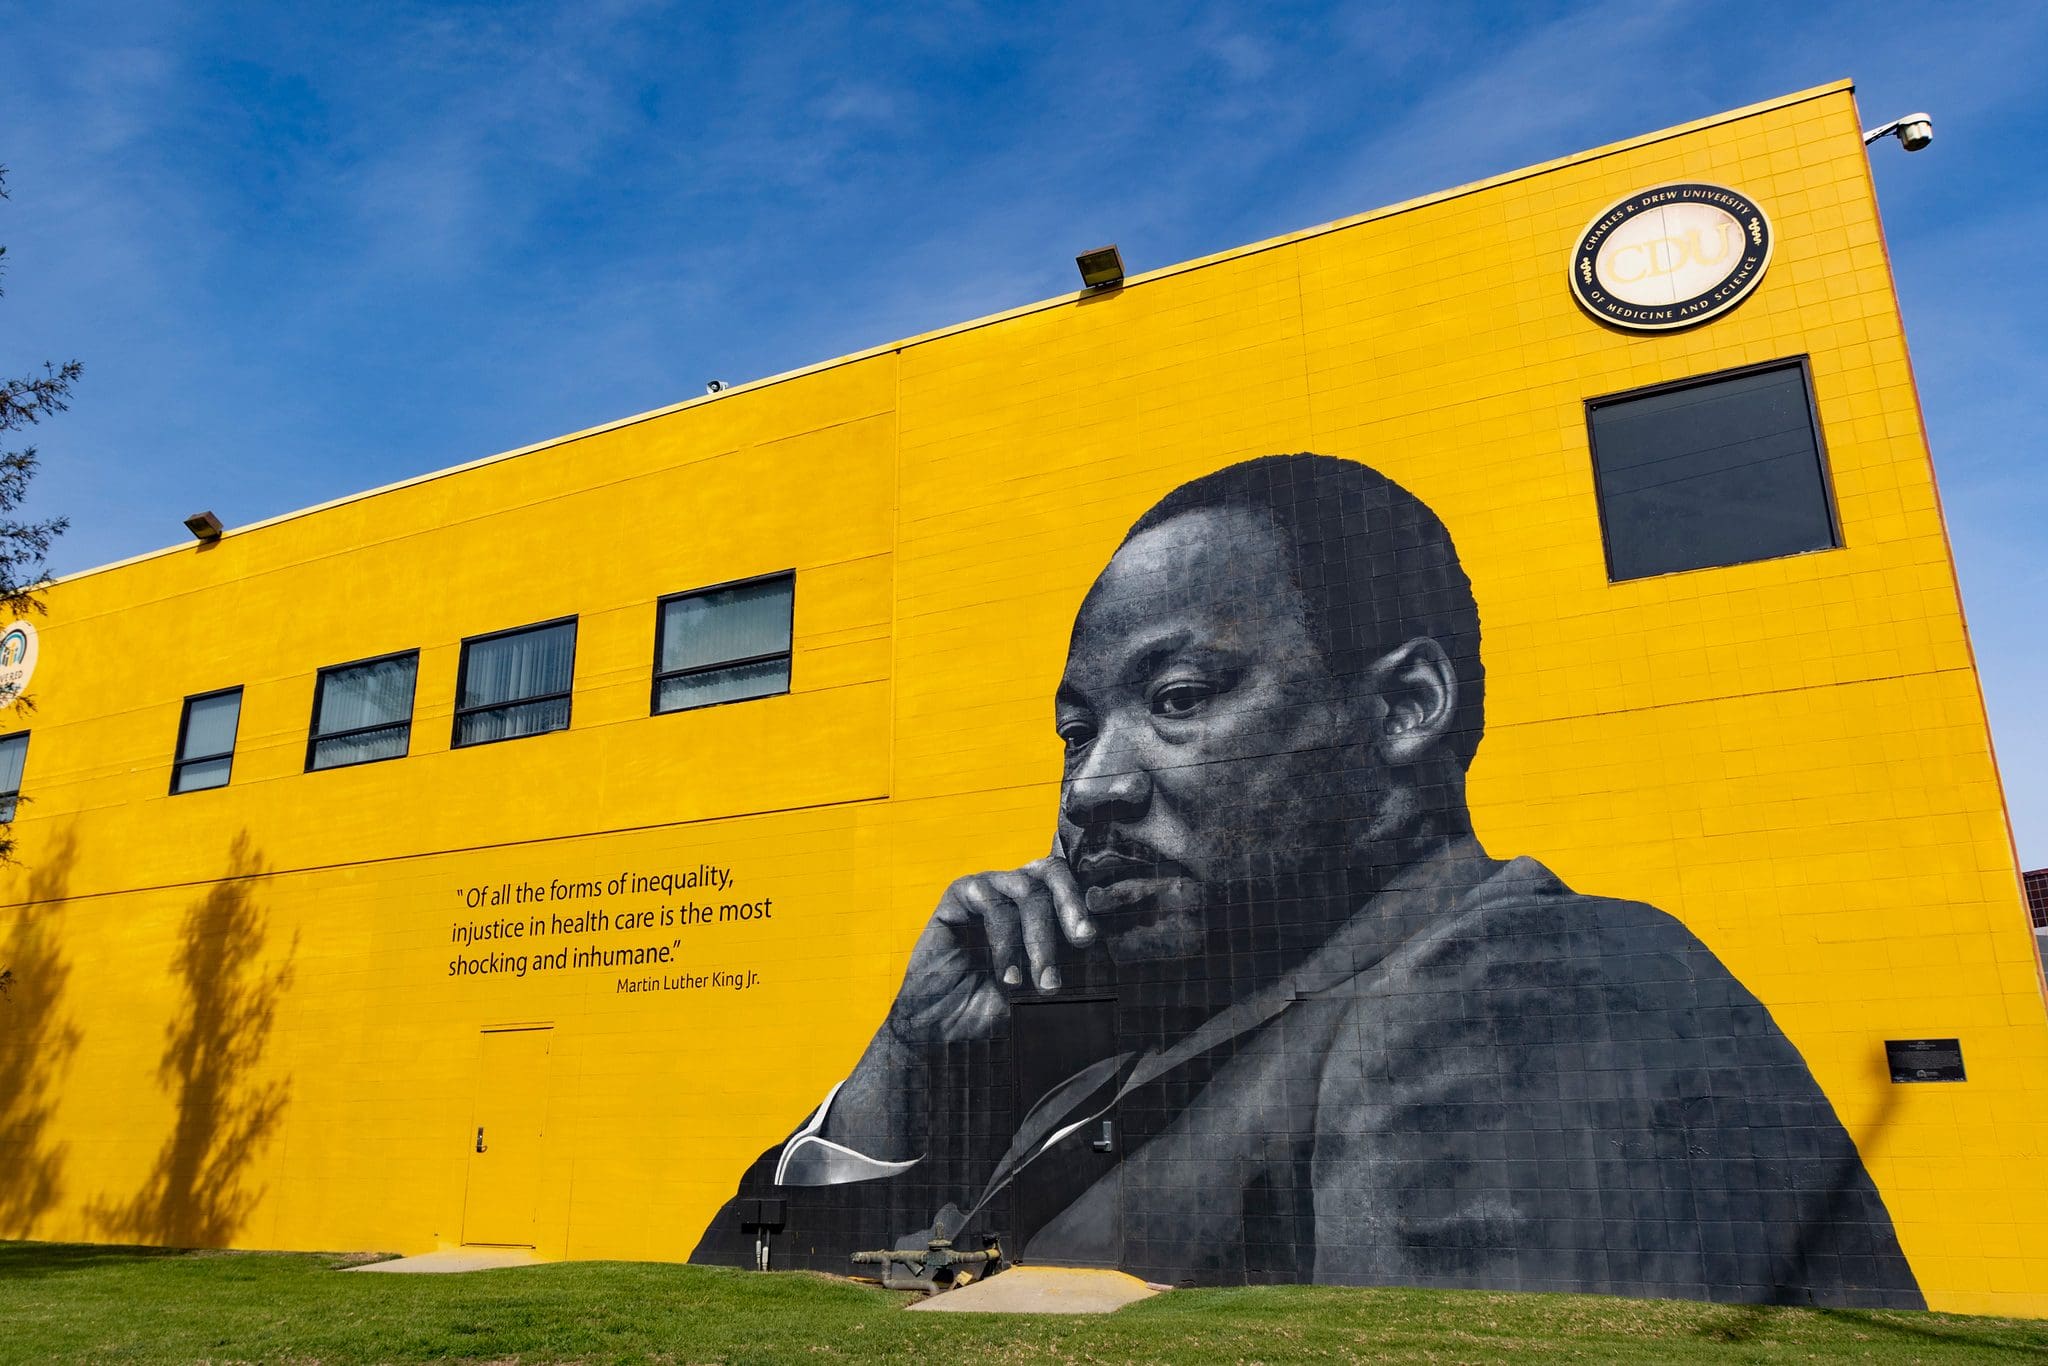
As Charles R. Drew University celebrates its 60th anniversary, we honor a history built through community strength, advocacy, and the generosity of those who believed in the power of this institution.
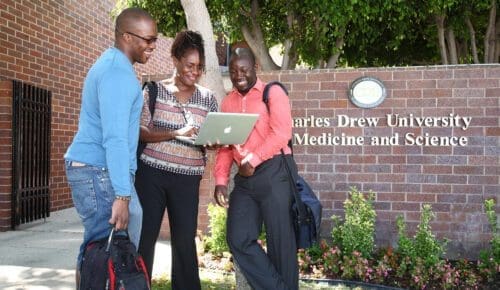


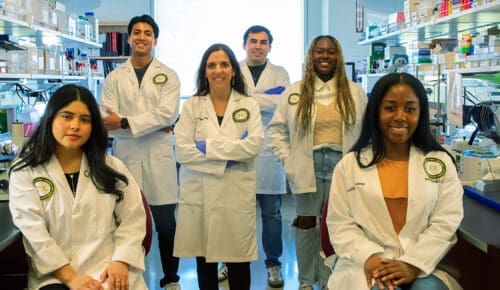


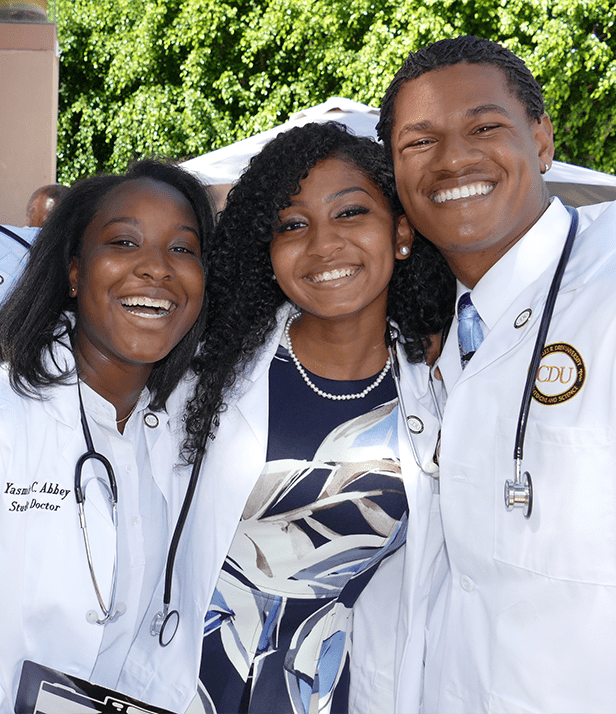
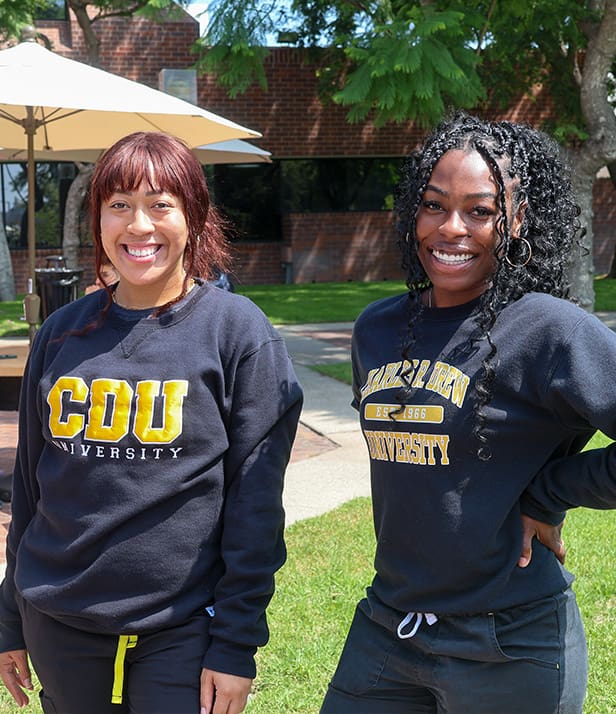
Is Charles R. Drew University right for you?
We offer a variety of degree programs for students interested in a wide variety of healthcare professions. After graduation, CDU students often return to practice and provide care in underserved communities.
Learn more about being a student at CDU.
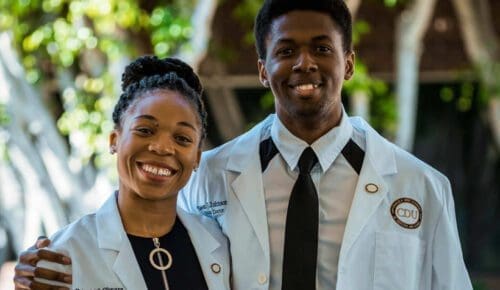
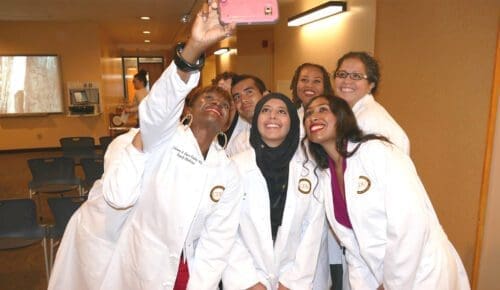
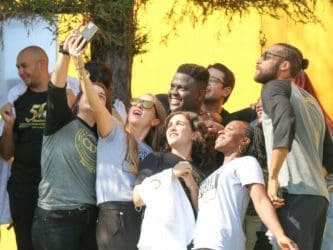
The motivation to serve. The skills to make a world of difference.
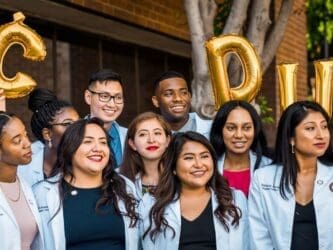
CDU is celebrating 60 years of education, service, and community impact through 2026. Students, alumni, partners, and community members are invited to stay connected, receive anniversary updates, and learn how to participate.
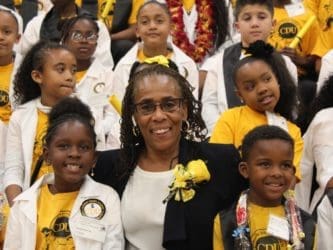
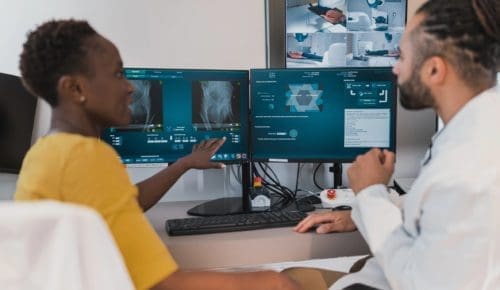
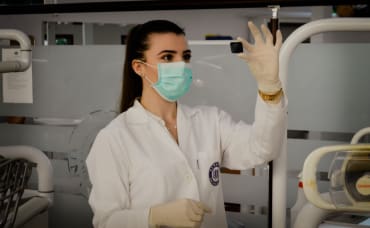
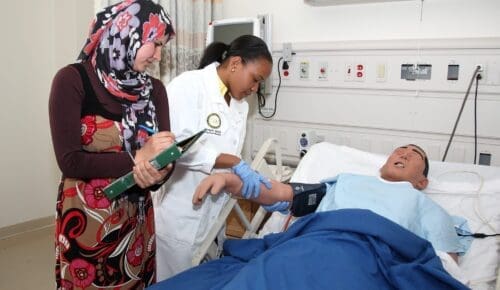
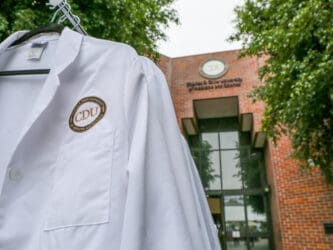
Our community healthcare programs, run by faculty and students, provide valuable care for vulnerable populations in the south Los Angeles area.
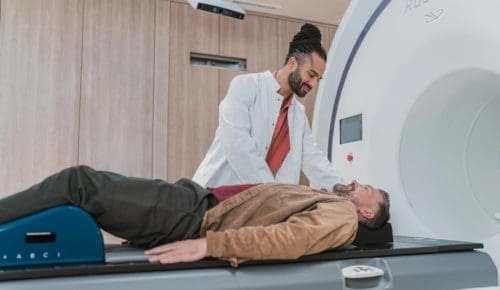
CDU graduates often return to underserved communities to work as healthcare providers. Ongoing research and health policy efforts focus on the root causes and the impact of health disparities.

News & Events
Charles R. Drew University of Medicine and Science (CDU) has been ranked #26 (tie) among the nation’s colleges and universities with the highest-paid graduates,…